Having big Jenkins cluster requires monitoring many things. Lately we started saving information about what build ran on which machine and when. Jenkins actually provides that feature, this is called “Build history” and can be seen for the whole cluster or for some particular node. Unfortunately, when cluster is quite big (ours has more than 300 executors serving more than 10000 builds per day) Jenkins is not able to show the graph.
So we decided to build it ourselves. We are already using Telegraf for monitoring Jenkins, InfluxDB for storing time series data and Grafana for displaying the graphs. Jenkins provides the information we require through API, so all we had to do is to make a new kind of request to Jenkins Master. The API url is:
http://<jenkinsserver>/computer/api/json?tree=computer[displayName,oneOffExecutors[number,currentExecutable[fullDisplayName]],executors[number,currentExecutable[fullDisplayName]]]Instead of json you can use xml too, but I am parsing the result using ruby and it’s more
comfortable to parse json in ruby. We have to make a request not only for executors - those are
responsible for ordinary jobs, but also for oneOffExecutors - those show the pipeline jobs.
Number in the executors shows the executor number and currentExecutable.fullDisplayName shows
job name, build number (and configuration for matrix jobs). Unfortunately number in the
oneOffExecutors is always -1, but we actually do not care about the executor number, we just need
to know what build runs when and on what machine.
The parsed data gets written into the database so that node, job, build and config are used as tags and the only metric data is the executor number:
jenkins.build,node=marine,job=my-test-job-1,build=132,config=ubuntu\,clean executor=0
jenkins.build,node=tank,job=my-test-job-2,build=12,config=ubuntu executor=-1
Then in grafana we have to make a query for node and group by all the other tags:
SELECT mean("executor") FROM "jenkins.build" WHERE "node" =~ /^$node$/ AND $timeFilter GROUP
BY time($interval), "job", "build", "config" fill(none)
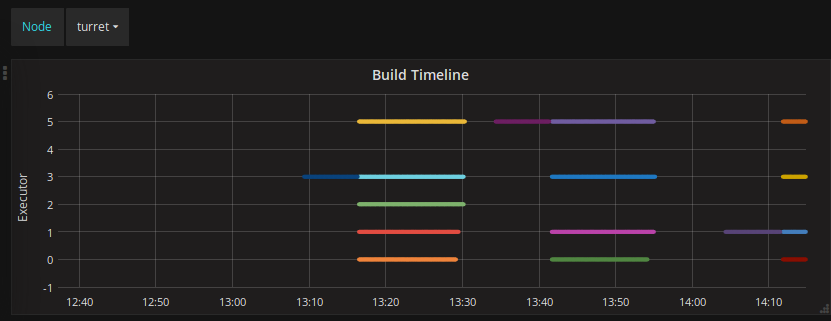
Which gives us a beautiful picture:

where every straight line is 1 build of 1 job.
comments powered by Disqus